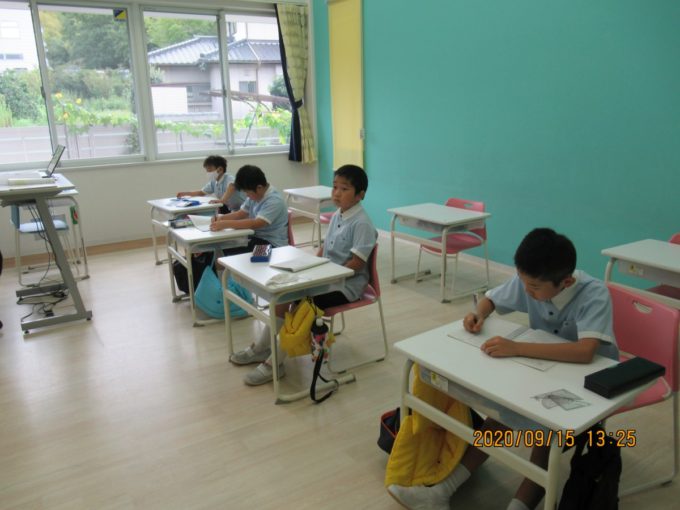
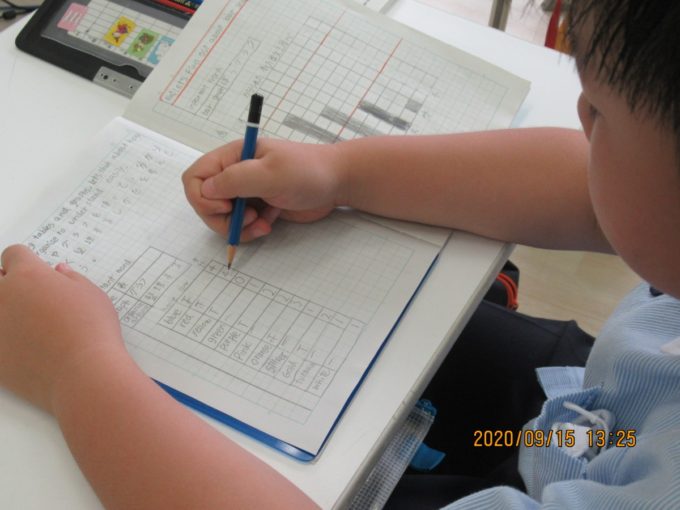
Bar graph
Third graders learned the unit of bar graph in Math class. First, they started by collecting data. They visited each class and asked the question, “What’s your favorite color? ” to all the students and teachers. The students all gave their own answer and shared their favorite. It was fun for all of the students.
After that, they put that data into a bar graph. They learned how bar graphs show differences of data visually.